Variance is a very important term in statistics, and in probability theory, it also plays an important role. Variance generally refers to the measurement of the scattered set of numbers or values that are spread out from their average value.
The variance was first introduced in 1918, and Mr. Ronald fisher gave the concept of this term. He wrote the concept of variance in his scientific paper which was published by the royal society of Edinburgh. In this article, we will study the basic definition of variance and its types, there is also an example section.
CONTENT INDEX
Definition of variance:
“In probability theory and statistics, variance is the expectation of the squared deviation of a random variable from its population mean or sample mean.” The data values could be sample or population.
Sample:
Sample refers to a random collection of data from a large data (population) i.e. a factory produces 1000 bulbs on daily basis and we want to check the quality of all bulbs then we will take 10 bulbs out of that 1000 (1 from every 100). The chances of error in the sample are more than in the population.
Population:
The population data is the total number of relevant observations. It is typically larger than a sample, and the ratio of errors is very less as compared to the sample data i.e. in the above example, the total number of bulbs (1000) is the population. The population is always greater than the sample.
Types of variance:
There are two basic types of variance:
- Sample variance
- Population variance
1. Sample variance:
The variance of sample data is represented by S2 and is given by:
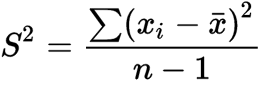
- S2 is the variance of the sample data.
- xi is the number of terms.
- x̄ is the mean of the sample data.
- n is the total terms.
2. Population variance:
The population variance is represented by σ2 and is given by:
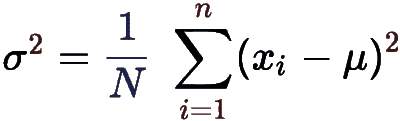
- σ2 is the variance of the population data.
- xi is the number of terms.
- µ is the population mean.
- N is the total terms.
How to calculate the variance of sample data?
There are a few steps to calculate the variance, the steps are as follows.
- First of all, find the mean of the given sample data i.e.
- Find the difference between the values and the mean.
- Find the square of the difference.
- Sum up the squared values.
- The last step is to divide the calculated value by “n – 1” (for sample variance) to get the final answer.
How to calculate the variance of population data?
There are a few steps to calculate the variance of population data.
- First of all, find the mean of the given population data i.e.µ
- Find the difference between the values and the mean (deviation)
- Find the square of the difference.
- Sum up the squared values. (Sum of squares)
- Divide the calculated value by “N” (for population variance) to get the final answer.
Examples of variance:
Example 1: For Sample Variance.
Calculate the variance of the sample data 12, 45, 23, 86, 43, 97
Solution:
Let x = 12, 45, 23, 86, 43, 97
Total terms = n = 6
Formula:
Step 1: Find the mean of the sample data
Mean = = (x) / n
Mean = = (12 + 45 + 23 + 86 + 43 + 97) / 6
Mean = = 306 / 6
Mean = = 51
Step 2: Find the difference between the values and the mean.
12 – 51 = – 39
45 – 51 = – 6
23 – 51 = – 28
86 – 51 = 35
43 – 51 = – 8
97 – 51 = 46
Step 3: Find the square of the difference.
(– 39)2 = 1521
(– 6)2 = 36
(– 28)2 = 784
(35)2 = 1225
(– 8)2 = 64
(46)2 = 2116
Step 4: Sum up the squared values.
Sum of squares = 1521 + 36 + 784 + 1225 + 64 + 2116
Sum of squares = 5746
Step 5: Divide the calculated value by “n – 1” because we are finding the variance of the sample data
Variance = S2 = (5746) / (6 – 1)
Variance = S2 = (5746) / 5
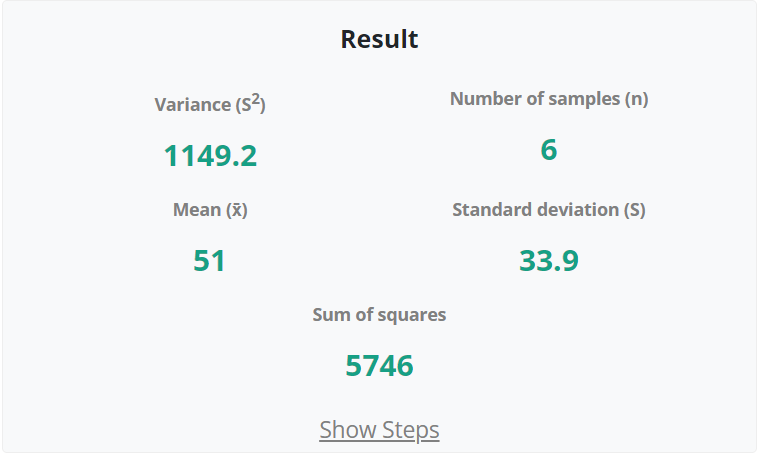
Variance = S2 = 1149.2
A variance calculator by Allmath is an online resource to get rid of the above lengthy calculations.
Example 2: For Population Variance.
Calculate the variance of the population data 92, 54, 71, 20, 67, 34, 12
Solution:
Let X = 92, 54, 71, 20, 67, 34, 12
Total terms = N = 7
Formula:
Step 1: Find the mean of the population data µ
Mean =µ = (X) / N
= (92 + 54 + 71 + 20 + 67 + 34 + 12) / 7
= 350 / 7
= 50
Step 2: Find the difference between the values and the mean (deviation)
92 – 50 = 42
54 – 50 = 4
71 – 50 = 21
20 – 50 = – 30
67 – 50 = 17
34 – 50 = – 16
12 – 50 = – 38
Step 3: Find the square of the difference.
(42)2 = 1764
(4)2 = 16
(21)2 = 441
(– 30)2 = 900
(17)2 = 289
(– 16)2 = 256
(– 38)2 = 1444
Step 4: Sum up the squared values. (Sum of squares)
Sum of squares = 1764 + 16 + 441 + 900 + 289 + 256 + 1444
Sum of squares = 5110
Step 5: Divide the calculated value by “N” because we are finding the variance of the population data
Variance = S2 = (5110) / (7)
Variance = S2 = 730
Summary
In this article, we have studied the basic definition of variance, and the general history of this term. We have also read about the types of variance and the difference between the sample and the population. We have also gone through the method of finding the variance.